Social media report template for clients, and how to build it in 30 minutes
A social media report template for client work: what to include, which numbers to report, and how to build the monthly report from analytics in 30 minutes.
Este artículo solo está disponible en inglés.
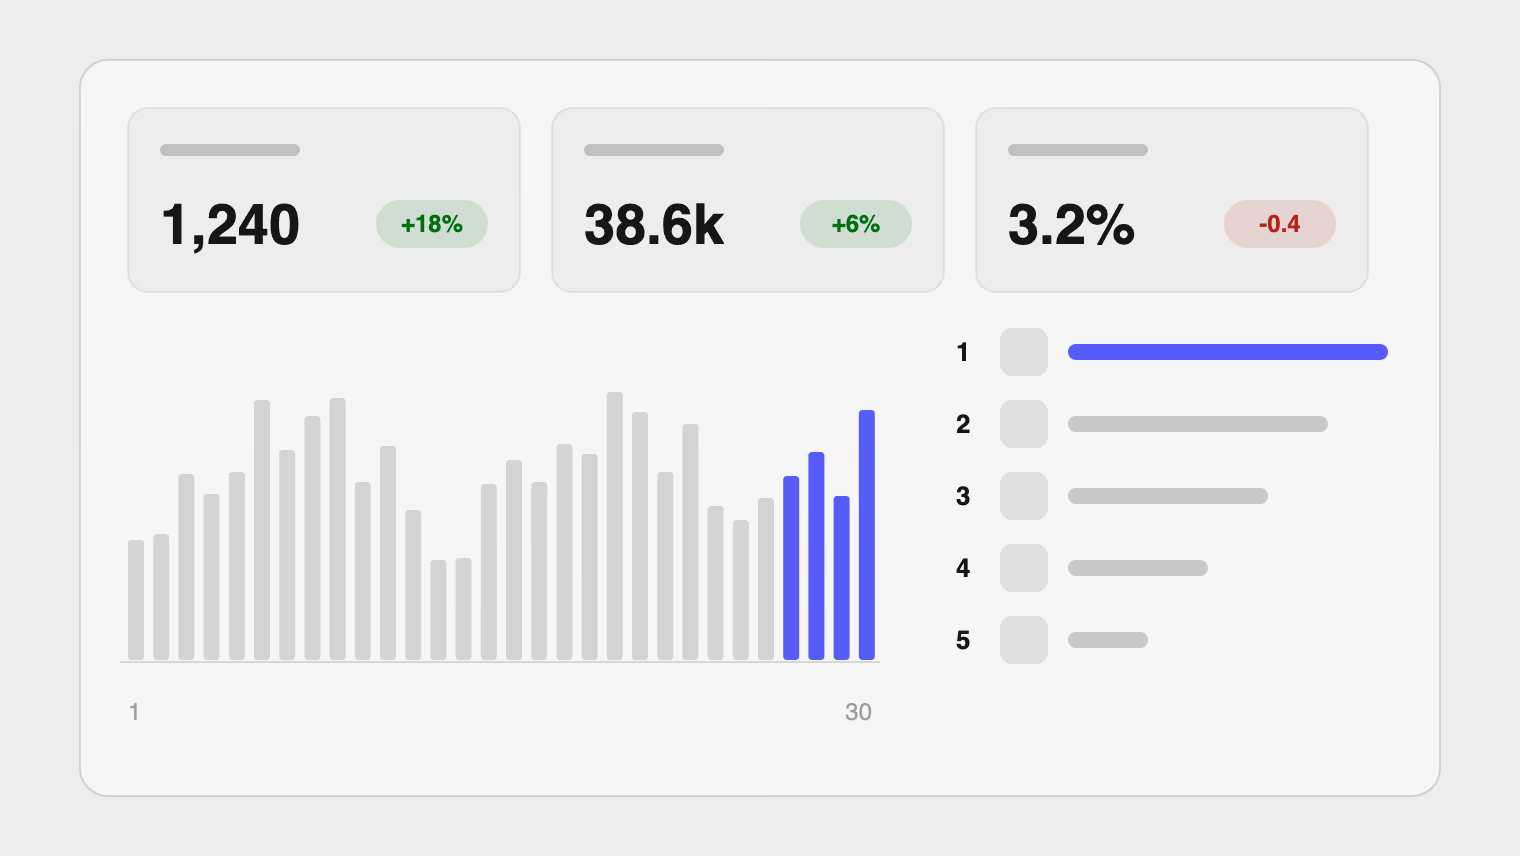
A monthly client report answers three questions on one page: what went out, what worked, and what you will change next month. Everything else is evidence for those answers. The template below covers each part and says where its numbers come from. After it comes a 30-minute routine for building the report from one analytics page instead of eight network apps.
The routine uses Publedia's Analytics page, but the template works with any source of numbers.
What to put in a monthly social media report
Keep the report to one or two pages. The client wants to know whether the money and time are well spent, not to read every figure.
| Section | What goes in it | Where the number comes from |
|---|---|---|
| Summary | Three sentences: what happened, the main result, the main change for next month | Written last, from the other sections |
| What was published | Posts per channel and the types of post (video, image, text) | Count of posts in the period, from your calendar or the Top posts table |
| Headline figures | Engagement and impressions or views, each against the previous month | Analytics headline figures, which show the change against the previous period |
| Top posts | The best five posts and one line each on why they worked | Top posts table, sorted by engagement, then by rate |
| What did not work | The weakest posts or a drop, with the cause if you know it | Top posts table (lowest rows), plus your own notes |
| Next month's plan | One thing to do more of, one to stop, one to test | Your reading of the top posts |
| Asks from the client | Approvals, photos, product news, access that is missing | Your notes from the month |
Write the summary last, and keep it to three sentences. A client who reads only that paragraph should still know how the month went and what happens next. If you cannot say it in three sentences, the report has too many numbers.
The "asks" section is easy to skip and worth keeping. Most weak months trace back to missing material from the client, and a written ask in the report is harder to forget than a message in a chat.
Which numbers to report, and which to leave out
Report numbers that lead to a decision. A figure that could not change what you post next month is decoration.
- Engagement: the sum of likes, comments, shares and saves a network reports for a post. It is the one number almost every network fills, so it is the safest headline.
- Impressions or views: how often a post was shown or a video was played. These show reach, and different networks use different definitions, so quote them per channel.
- Rate per post: a post's engagement divided by its impressions. It shows which posts earned attention from the people who saw them, even when the post was small.
Do not report one engagement rate for the whole account across several networks. Engagement and impressions come from different sets of posts, because not every network reports both. Dividing one total by the other gives a number that describes none of them. Show the rate per post and per channel instead.
Follower counts are common in client reports, but the Analytics page does not show them. If a client expects follower growth, take it from each network's own app and keep it in a separate line, clearly labelled. Treat it as context, not as the result of the month. Followers say little about whether this month's posts did their job.
Each network reports a different set of metrics, so the report should too.
| Network | Metrics |
|---|---|
| X | Impressions, likes, comments, shares, saves |
| Impressions, likes, comments, shares, clicks | |
| Impressions, likes, comments, saves | |
| TikTok | Impressions, views, likes, comments, shares |
| YouTube | Views, likes, comments |
| Threads | Views, likes, comments, shares |
| Bluesky | Likes, comments, shares |
| None yet |
LinkedIn reports no metrics to Publedia yet. For a client with a LinkedIn profile, read the numbers from LinkedIn's own analytics and say so in the report, so the client knows why that channel looks different. LinkedIn's combined post analytics, in the profile's Analytics & tools section, covers up to the past 365 days and exports to an .XLSX file.
Build the report in 30 minutes
This routine assumes each client has their own workspace, as described in how agencies keep client accounts separate. The numbers on the page are then only that client's.
- Switch to the client's workspace from the menu at the bottom of the sidebar.
- Open Analytics and set the range to the last 30 days, with all channels selected.
- Read the headline figures and their change against the previous 30 days. Write them into the report as they are, with the direction of the change.
- Sort Top posts by engagement and note the top five. Look for what they share: a topic, a format, a network, a time of day.
- Sort by rate as well. A post with a high rate on few impressions is worth posting again at a better time or on another network.
- If one channel looks odd, filter to that channel and repeat steps 3 to 5 for it.
- Select Export CSV and paste the post table, or the part of it you need, into your report document.
- Write the three-sentence summary and the next month's plan: one thing to do more of, one to stop, one to test.
The page, sorting and channel filter are on every plan. Totals, the comparison between channels, Export CSV and the 90-day range are included from Pro (see pricing). On Basic you can still read the Top posts table and copy from it by hand.
For more on what each figure means, and why numbers can differ from a network's own app (timing, definitions and scope), see read your analytics. Posts published outside the workspace are not counted, so a client who also posts by hand will see lower totals here than in the network app.
Explaining a bad month
A drop is not a failure of the report. Hiding it is. Clients accept a bad month when the report names the cause and the fix, and they stop trusting reports that show only good news.
Compare like with like. The headline change is measured against the previous period of the same length, so a 30-day range against the 30 days before it is a fair test. Do not set a month against a quarter, or a holiday month against a normal one without saying so.
Then name the cause. The usual ones are:
- Fewer posts: a gap in the calendar, often because material arrived late. Say so, and add it to the asks.
- A failed post: a post that did not go out, so its numbers are missing. Check the post's status first. Why scheduled posts fail lists the common reasons and what to do about each.
- A network change: a new format, a change in how posts are shown, or a changed definition of a metric. Note it as context, and do not blame it without evidence.
- A weak topic or format: the honest answer when the top posts of earlier months look nothing like this month's.
End with one fix for next month. A bad month with a clear cause and a plan reads better than a flat month with no explanation.
What the Analytics page does not do for reports (yet)
- No PDF or white-label report. The report document is yours, in a doc or slides, with your branding.
- No scheduled report emails to clients.
- History reaches back 90 days, so keep each month's export if you want a longer comparison.
- No follower growth numbers.
- No LinkedIn metrics yet.
If your clients expect a branded PDF produced automatically, this is a gap today. The routine above gets the numbers and the top posts into your own document in about half an hour.
New to running several clients? The client onboarding guide covers what to collect before the first post, which makes the first report much easier to write.
Fuentes
Temas
- Agencies
- Reporting
- Analytics
- Client management